Friday, March 29, 2013

GIS II: Network Analysis

Introduction

As stated before, the goal this semester is to create a project involving different components of ArcGIS to model the impact of frac sand mining in Western Wisconsin. In the previous assignments, all the datasets were downloaded and organized into a geodatabase and then all of the sand mines (121) were geocoded to their proper locations. This week's exercise involves the Network Analysis extension in ArcMap. The goal is to assess the impact that transporting the sand from mines to railroad has on the roads in each county. Since the equipment used in the delivery process is very heavy, the roads tend to experience heavy stress and rapid deterioration. With network analysis, the user can find the closest railroad terminal for each sand mine and determine the most efficient transportation route. The other goal is to assess the road maintenance cost that will affect each county based on the amount of road distance being traversed in each county.

Methodology

The first thing that our group did this week was to merge all of our geocoded mines into a single feature class. We needed to do this before we could start any sort of analysis, plus it just makes more sense from a data management standpoint to create a single feature. This involved getting all four of the separate feature tables normalized so that they contained all of the same fields which is necessary for merging to work.

Fig. 1 - Merged mines feature class.

 After this was done, the feature was projected to match all of the other features inside the geodatabase. For this exercise, we also needed a shapefile for the railroad terminals, the locations where the sand is delivered to to be then put on a rail car. A shapefile was made available in a share folder where each student could import it into their geodatabases. Since many of the railroad terminals are private, they were not included with this shapefile and therefore many actual terminals are not included for analysis. This feature was then added into ArcMap along with the sand mine locations. The next task was to connect to the ESRI public folder which contains a ton of files. We needed to find and add the USA_streets network dataset. A network analysis cannot be done without a network dataset. Once all three datasets were displayed, a new network analysis (NA) window was opened. From the NA dropdown, "New Route" was selected and then the sand mine feature was added to "Stops". The software solved the route analysis by showing a route connecting all of the sand mines based on the streets layer.


Fig. 2- Routes between mines solved by network analysis.

This analysis doesn't really answer the questions that we are seeking to answer. We want to know the impact of transportation. For this we need to: determine which rail terminal each mine will travel to, determine most efficient route, calculate length of route by county, and then estimate costs for each county. For this type of workflow, one should utilize the Closest Facility Function. In the NA dropdown, "New Closest Facility" was checked and then the mines were loaded into the Facilites and the rail terminals loaded into Incidents. Below is a result of the process.

Fig. 3 - Closest facility analysis.

After the analyis was run, it was apparent that it did not produce the correct results. The red dots are the sand mines, purple squares are terminals, and the brown lines are the calculated routes. The reason that the output is incorrect is because the features were loaded into the analysis incorrectly. To fix this, the mines need to be loaded into Incidents and the rail terminals loaded into Facilities. This makes more sense since we are trying to find the closest facility. This was an important concept to understand: make sure the features are loaded correctly into the analysis window or else erroneous results will occur. Here is a an image of the corrected analysis.

Fig. 4 - Correct "Closest Facility" analysis.
 
Here we flipped the symbols so that the mines are purple boxes and the rail terminals are red circles. This result makes way more sense now that each mine is matched to the closest rail terminal. With this, we can tell the distance from each mine to the closest rail terminal.

Conclusion

This exercise gives a glimpse into the dynamic abilites that network analysis offers. More detailed routes can be determined by applying cost factors to the formula. For the next part of this project, we will be using Model Builder to help automate the process and save it to a permanent location in the geodatabase so it's easy to access in the future. Also, we will be determining the cost aspect of the transportation as well as calculate total road length per county being used in the transportation process.




Wednesday, March 13, 2013

GIS II: Base Data Collection

Introduction

As a way for the class to get some real world experience in building a relevant project from scratch, all of the data that is being used for the Western Wisconsin Sand Mining project will need to be gathered from a range of different resources. It is not very realistic to have all of the data already compiled nice and neatly in a geodatabase ready for use. It is very important to be able to have the knowledge of all of the available resources where data can be freely accessed. One of our class lectures involved the class making a list of all of the websites that they had previously used to download data for previous projects. What we came up with was basically a list of governmental websites such as the DNR or USGS where there is an enormous amount of free data available. Even though the data is being downloaded from different sources, all of the datasets are interoperable. This means that data coming from different sources can still be used together in a GIS without any sort of conversions to normalize them.This is immensely efficient and saves a lot of time.

Methodology

Downloading the Data
The first thing that we did before we downloaded any data was to create a file geodatabase in which all of the data can be extracted to and saved as feature classes. A geodatabase is very dynamic and powerful way to store data. The projection for the geodatabase was defined as NAD83 UTM 15N. After the geodatabase was setup, we were instructed to go to http://www.nationalatlas.gov/ where we would find a dataset for railroads that covered North America. This particular file was an e00 file which is esentially an ArcCoverage file. The file was unzipped in Internet Explorer to the geodatabase where it could be stored as a feature class. The next dataset we were after was a land use/land cover (LULC) raster for Trempeleau County. The first website that we checked was http://www.fws.gov/wetlands/ where there was an interactive web mapper from which to extract data from. Once zoomed into Trempeleau County, it was apparant that there was no data available for this county. In times like this, it is important to check other possible sources. The next stop was http://nationalmap.gov/viewers.html where we were finally able to find a LULC raster from 2006 for Trempeleau County. An elevetion dataset, or DEM, was also downloaded. Since this dataset was so large, it was split up into two tiles which meant that they had to be mosaicked together. This required a simple process using the Raster Mosaic tool in ArcToolbox in ArcMap. Since the elevation values exceed 255, the raster needed to be saved as a 32 bit floating point raster. Cropland data was the next set of data we were to locate and download. The data was found at http://datagateway.nrcs.usda.gov/ where we had to enter some personal information and an email address before the data could be sent. Once again, the data was unzipped into the WesternWisconsin geodatabase. The final set of data we needed from this lab assignment was SSURGO soil data. Trempeleau County was selected as the data extent, and then the data was then unzipped. This time, however, there was a file that we needed, in the form of a Microsoft Access geodatabase. From Microsoft Access, we had to use a macro to import all of the tabular data into our geodatabase. This was a bit confusing at first since I had never used Access before. Along with the tabular data was a Data Model Diagram which showed which "key" field should be used to relate all of the data. This key turned out to be called mukey. A relationship class was created to join the tabular soil data to the soil feature class. Finally a soil drainage and productivity index table in the form of an Excel document was downloaded and then joined to the soils feature class as well via a relationship class. After all the data was downloaded, each dataset needed to be projected to the same projected coordinate system. As mentioned above, everything for this assignment will be projected to NAD83 UTM 15N.
Fig. 1 - Base data feature classes.


Geocoding


The second lab assignment called for yet even more data downloading and also some geocoding. This time we were targeting mine locations. Trempeleau County has a land records division website set up at http://www.tremplocounty.com/landrecords/ where we were able to download the entire Trempeleau County geodatabase. This geodatabase contains a TON of information and fields. One of the fields is for sand mine locations in Trempeleau County. However, since our study area is an area larger than just Trempeleau County, we needed to get a spreadsheet of all of the current (July 2012) sand mines in Wisconsin to be able to geocode them. The available spreadsheet was found here: http://www.wisconsinwatch.org/2012/07/22/map-frac-sand-july-2012/. There were some immediate issues obvious contained in the spreadsheet. There was a terrible compilation of addresses for mine locations, either lacking a complete address or none at all. The geocoder in ArcMap requires a complete address for accurate placement on the map. We also needed to add a State field so that the geocoder would reference the correct state of the addresses. The community field was the field used to reference the city or township the mine was closest to. After cleaning up and normalizing the data the best we could, we ran the data through the geocoder and only got approximately 50% of the 120 mines. In order to be able to geocode the rest of the points in a reasonable time frame, the remainder of the points were divided up between 4 group members. I was assinged 18 mines which, for the most part, lacked any locational reference besides the community field. 

Fig. 2 - Address table lacking proper addresses.

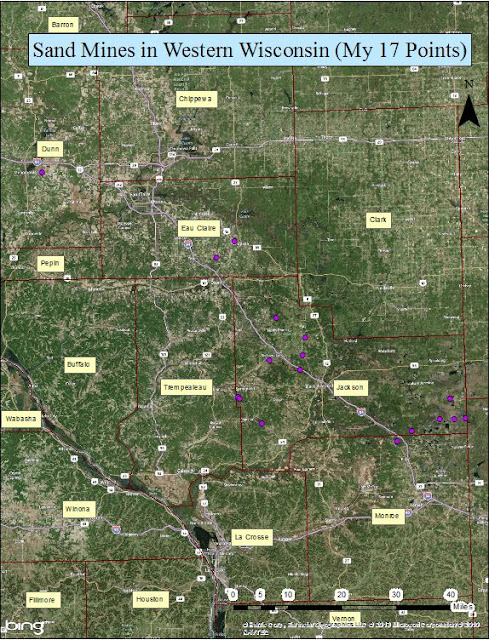
There were also addresses which were in the form of PLSS. In order to find these, we had to connect to another server, containing datasets for WI, where there was a statewide shapefile of PLSS divisions. This allowed us to find the correct segment and then use high resolution aerial imagery to put the point in correct location. What I ended up doing was geocoding the points to the Community field so that the point would be put into the center of the city and then I could start an editing session to manually move the point to its correct location found through aerial imagery. Another great piece of reference I found to help find mine locations was a fusion table of sand mines located here: https://www.google.com/fusiontables/DataSource?docid=17nDFI4iUPOdyDOEWU7Vu1ONMiVofa3aWR_Gs-Zk#rows:id=1. Even though these points weren't exactly in the correct spot, they were very close and was extremely useful to be able to use this as a reference resource.


Fig. 3 - Correct locations of sand mines.


Monday, March 11, 2013

GIS II Lab 1: Base Data

Introduction

This class, Intermediate GIS or GIS II, involves building off the knowledge and skills gained in GIS I in order to gain a more in depth understanding of a wide array of tools and processes that ArcMap offers. All of the data gathered throughout the semester will be hence processed through the Arc suite of products i.e. ArcCatalog and ArcMap. The objective of the lab assignments are to get the class experience in finding and downloading data, building and managing a geodatabase, and applying tools available in ArcMap to create professional maps. Throughout the semester we will be integrating a geodatabase to accomodate a bevy of data focused on frac sand mining in Western Wisconsin.

Sand Mining in Wisconsin
Recent findings of domestic natural resource supplies in natural gas and petroleum in the U.S. have spurned a major boom in the mining industry. As demand continues to for these resources climbs, production levels have also been stressed to meet this demand. A new form of drilling, called hydrofracking, utilizes silica sand to assist in extracting maximum amounts of oil or gas from a particular well.

Silica (frac) sand mining has been around for hundreds of years but has recently gained enormous popularity just in the past few years as hydrofracking has become the industry standard for optimal oil extraction. This particular type of sand is injected, along with water and other chemicals, into a well under very high pressures which then force cracks to form in the bedrock. The sand helps to keep these cracks propped open which allow the oil or gas to escape quicker and easier, therefore leading to more productive well. (http://www.dnr.state.mn.us/lands_minerals/silicasand.html)

It just so happens that Western Wisconsin and Eastern Minnesota have the optimal geologic makeup of sandstone where this silica sand is unique to. This has led to a large increase in sand mine permits and activity in this area. It should be noted that there is no drilling for natural gas or petroleum in Wisconsin, but rather these sands are shipped to locations such as North Dakota or Texas where the major drilling is occurring. (http://dnr.wi.gov/topic/mines/silica.html)

Fig. 1 - Sandstone formations in Wisconsin along with sand mine locations.
curiousterrain.wordpress.com

Fig. 2 - A typical sand mine.


Fig. 3 - Silica Sand
www.startribune.com

Issues

Even though this recent explosion in domestic drilling is largely beneficial economically, it poses a threat to the natural landscape where the sand mines are located and also to the transportation routes used. Not only this, but mining leads to pollution of the ground water as well as the air. There has been strong opposition to the issuance of permits for sand mines by some civilian gorups and government officials alike. Quite a few mines are located right on the outskirts of some cities which create a lot of noise and commotion at night. Large amounts of water are also required for this particular type of mining which some say is a waste of our water resources.

As this continues to be a hot issue for debate, the goal this semester is to use GIS to analyze and assess data involving land use/land cover, transportation conduits, elevation, and soil data in order to figure out a resolution to please both sides. All of the data will be downloaded from various websites and then stored in a file geodatabase where it can be processed and manipulated to fit the objectives of the project.