As a way for the class to get some real world experience in building a relevant project from scratch, all of the data that is being used for the Western Wisconsin Sand Mining project will need to be gathered from a range of different resources. It is not very realistic to have all of the data already compiled nice and neatly in a geodatabase ready for use. It is very important to be able to have the knowledge of all of the available resources where data can be freely accessed. One of our class lectures involved the class making a list of all of the websites that they had previously used to download data for previous projects. What we came up with was basically a list of governmental websites such as the DNR or USGS where there is an enormous amount of free data available. Even though the data is being downloaded from different sources, all of the datasets are interoperable. This means that data coming from different sources can still be used together in a GIS without any sort of conversions to normalize them.This is immensely efficient and saves a lot of time.
Methodology
Downloading the Data
The first thing that we did before we downloaded any data was to create a file geodatabase in which all of the data can be extracted to and saved as feature classes. A geodatabase is very dynamic and powerful way to store data. The projection for the geodatabase was defined as NAD83 UTM 15N. After the geodatabase was setup, we were instructed to go to http://www.nationalatlas.gov/ where we would find a dataset for railroads that covered North America. This particular file was an e00 file which is esentially an ArcCoverage file. The file was unzipped in Internet Explorer to the geodatabase where it could be stored as a feature class. The next dataset we were after was a land use/land cover (LULC) raster for Trempeleau County. The first website that we checked was http://www.fws.gov/wetlands/ where there was an interactive web mapper from which to extract data from. Once zoomed into Trempeleau County, it was apparant that there was no data available for this county. In times like this, it is important to check other possible sources. The next stop was http://nationalmap.gov/viewers.html where we were finally able to find a LULC raster from 2006 for Trempeleau County. An elevetion dataset, or DEM, was also downloaded. Since this dataset was so large, it was split up into two tiles which meant that they had to be mosaicked together. This required a simple process using the Raster Mosaic tool in ArcToolbox in ArcMap. Since the elevation values exceed 255, the raster needed to be saved as a 32 bit floating point raster. Cropland data was the next set of data we were to locate and download. The data was found at http://datagateway.nrcs.usda.gov/ where we had to enter some personal information and an email address before the data could be sent. Once again, the data was unzipped into the WesternWisconsin geodatabase. The final set of data we needed from this lab assignment was SSURGO soil data. Trempeleau County was selected as the data extent, and then the data was then unzipped. This time, however, there was a file that we needed, in the form of a Microsoft Access geodatabase. From Microsoft Access, we had to use a macro to import all of the tabular data into our geodatabase. This was a bit confusing at first since I had never used Access before. Along with the tabular data was a Data Model Diagram which showed which "key" field should be used to relate all of the data. This key turned out to be called mukey. A relationship class was created to join the tabular soil data to the soil feature class. Finally a soil drainage and productivity index table in the form of an Excel document was downloaded and then joined to the soils feature class as well via a relationship class. After all the data was downloaded, each dataset needed to be projected to the same projected coordinate system. As mentioned above, everything for this assignment will be projected to NAD83 UTM 15N.
 |
| Fig. 1 - Base data feature classes. |
Geocoding
 |
| Fig. 2 - Address table lacking proper addresses. |
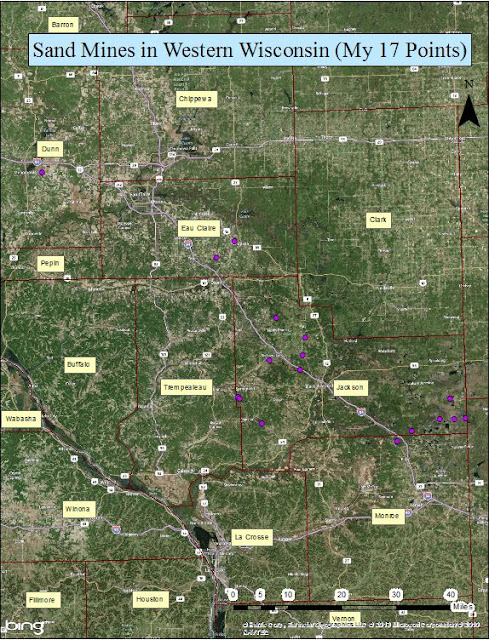
There were also addresses which were in the form of PLSS. In order to find these, we had to connect to another server, containing datasets for WI, where there was a statewide shapefile of PLSS divisions. This allowed us to find the correct segment and then use high resolution aerial imagery to put the point in correct location. What I ended up doing was geocoding the points to the Community field so that the point would be put into the center of the city and then I could start an editing session to manually move the point to its correct location found through aerial imagery. Another great piece of reference I found to help find mine locations was a fusion table of sand mines located here: https://www.google.com/fusiontables/DataSource?docid=17nDFI4iUPOdyDOEWU7Vu1ONMiVofa3aWR_Gs-Zk#rows:id=1. Even though these points weren't exactly in the correct spot, they were very close and was extremely useful to be able to use this as a reference resource.
 |
| Fig. 3 - Correct locations of sand mines. |
No comments:
Post a Comment